A/B Testing and Eye Tracking
Context
This project was made for CSCI 1300: User Interfaces and User
Experiences, a class at Brown University taught by
Jeff Huang. Our
goal was to research how affordances affect user behavior by analyzing
data through A/B testing and eye tracking.
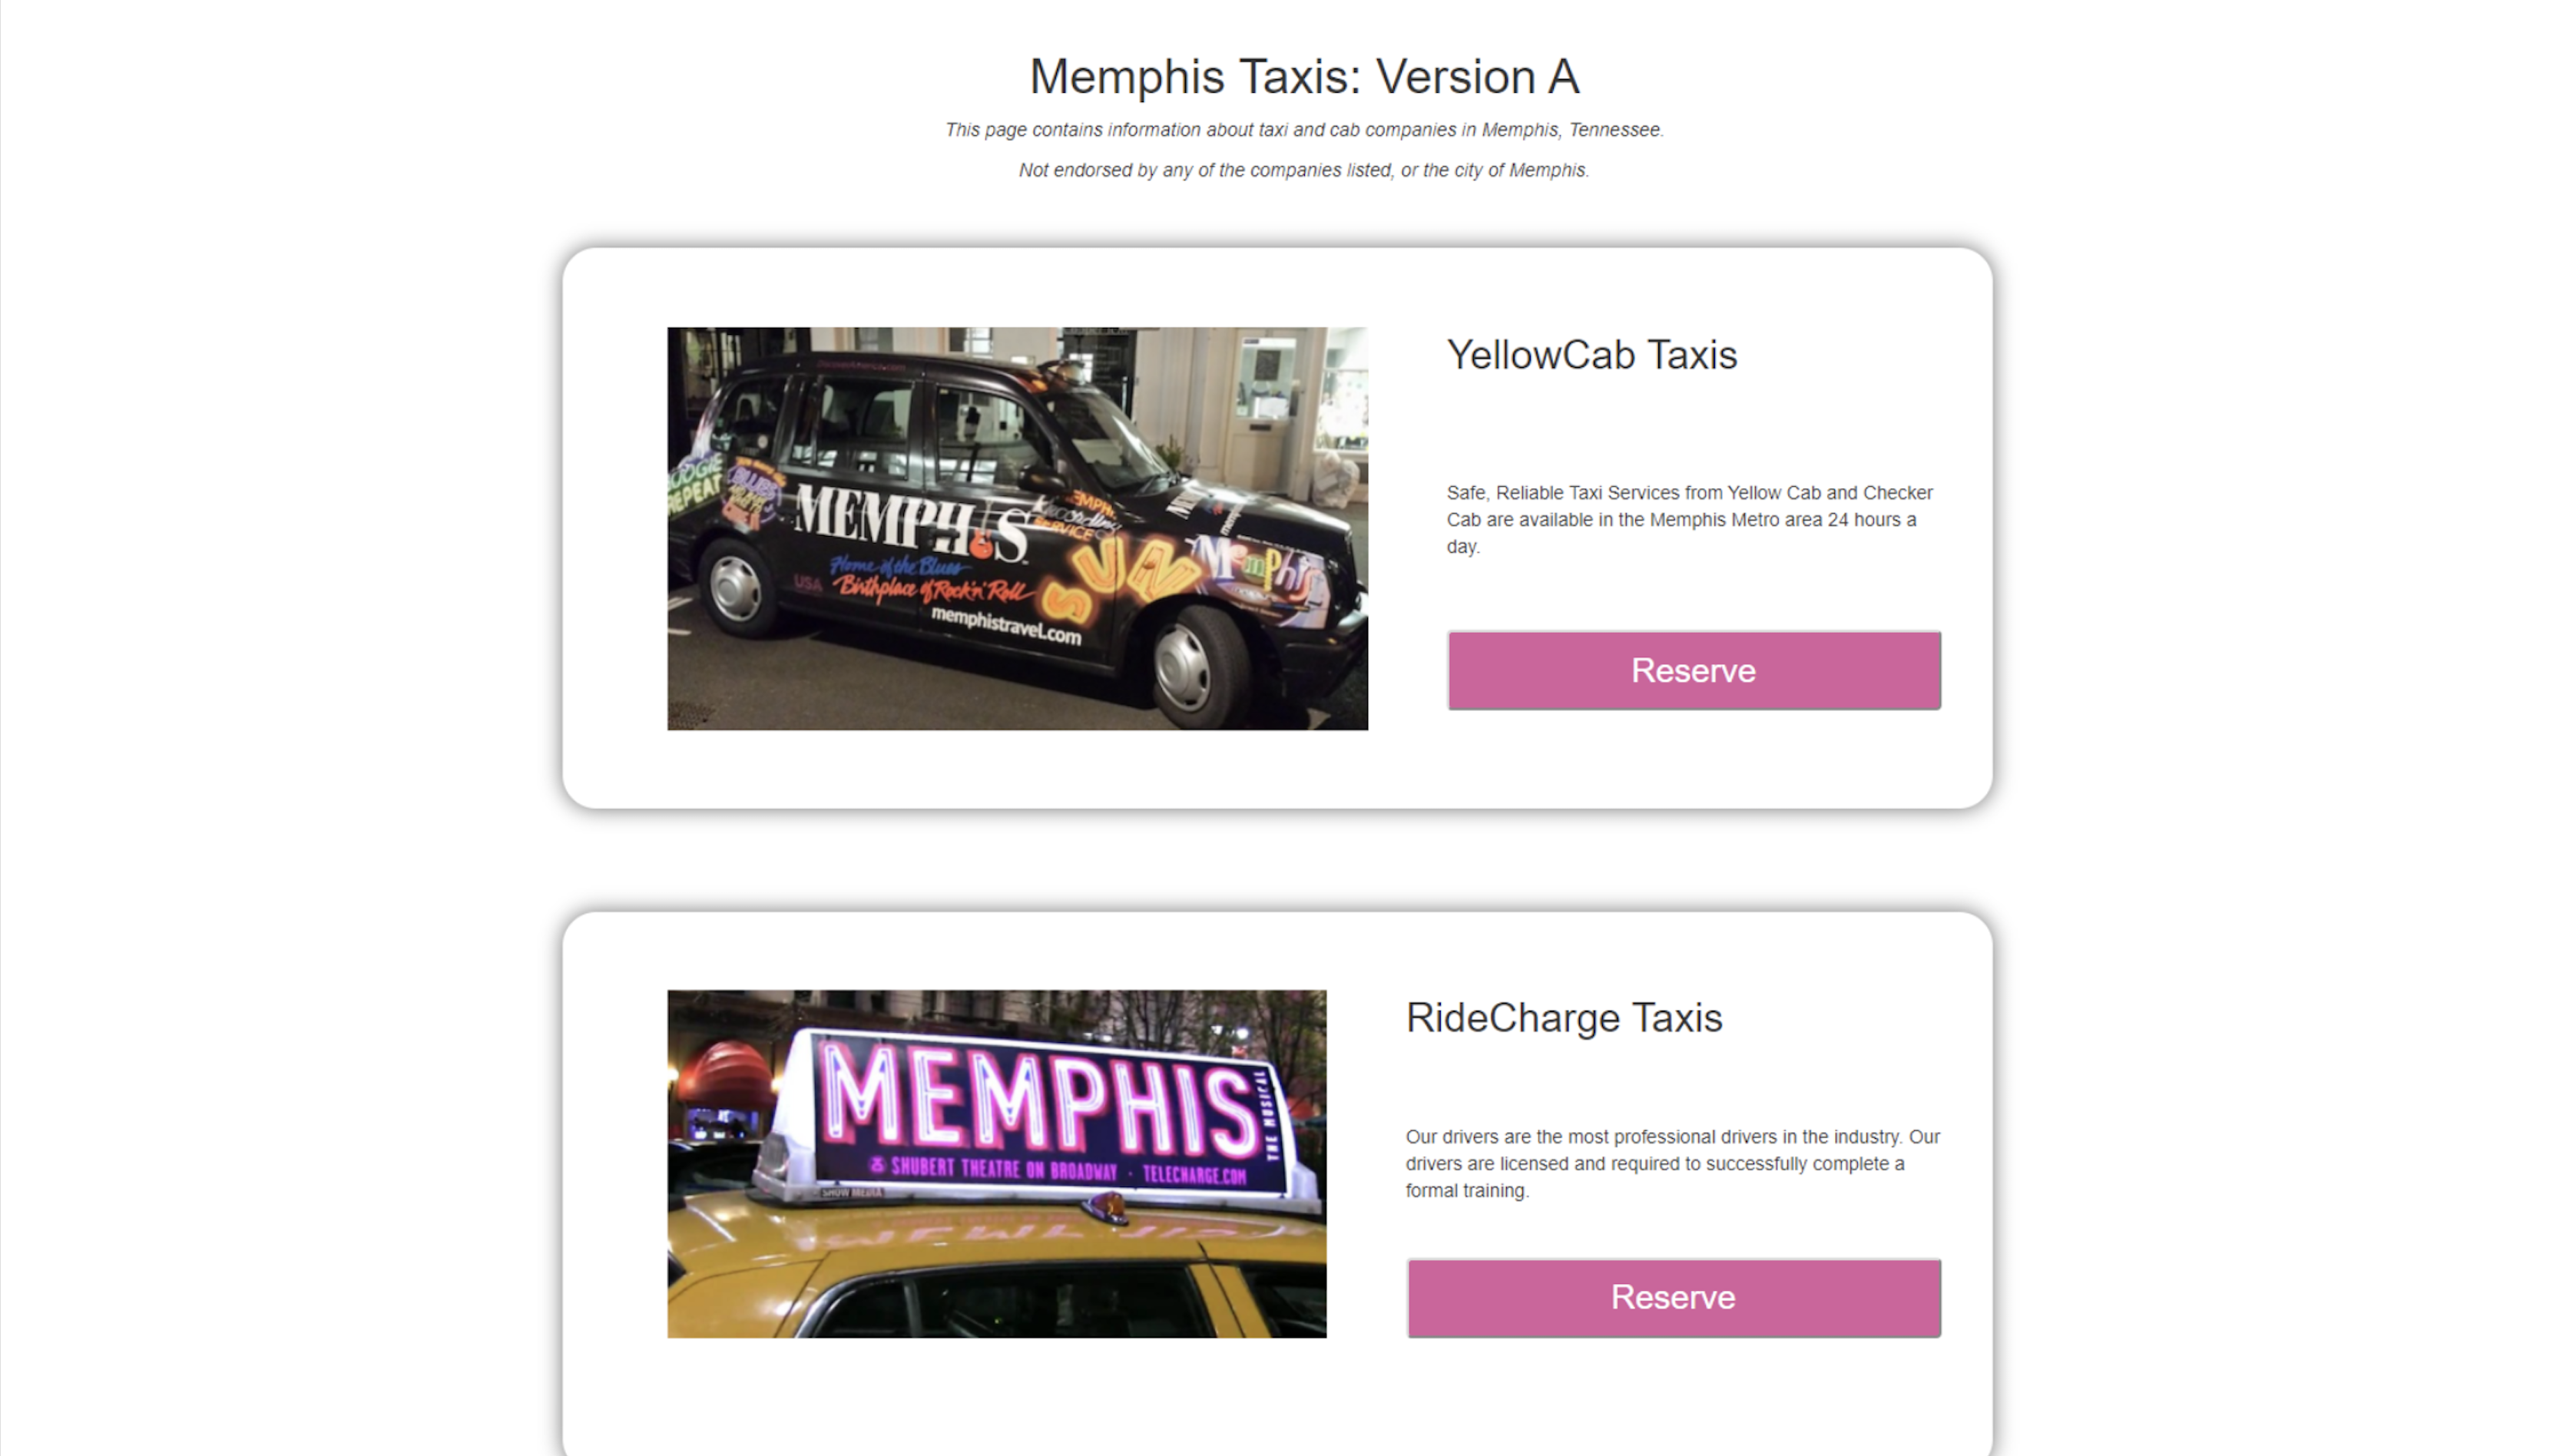
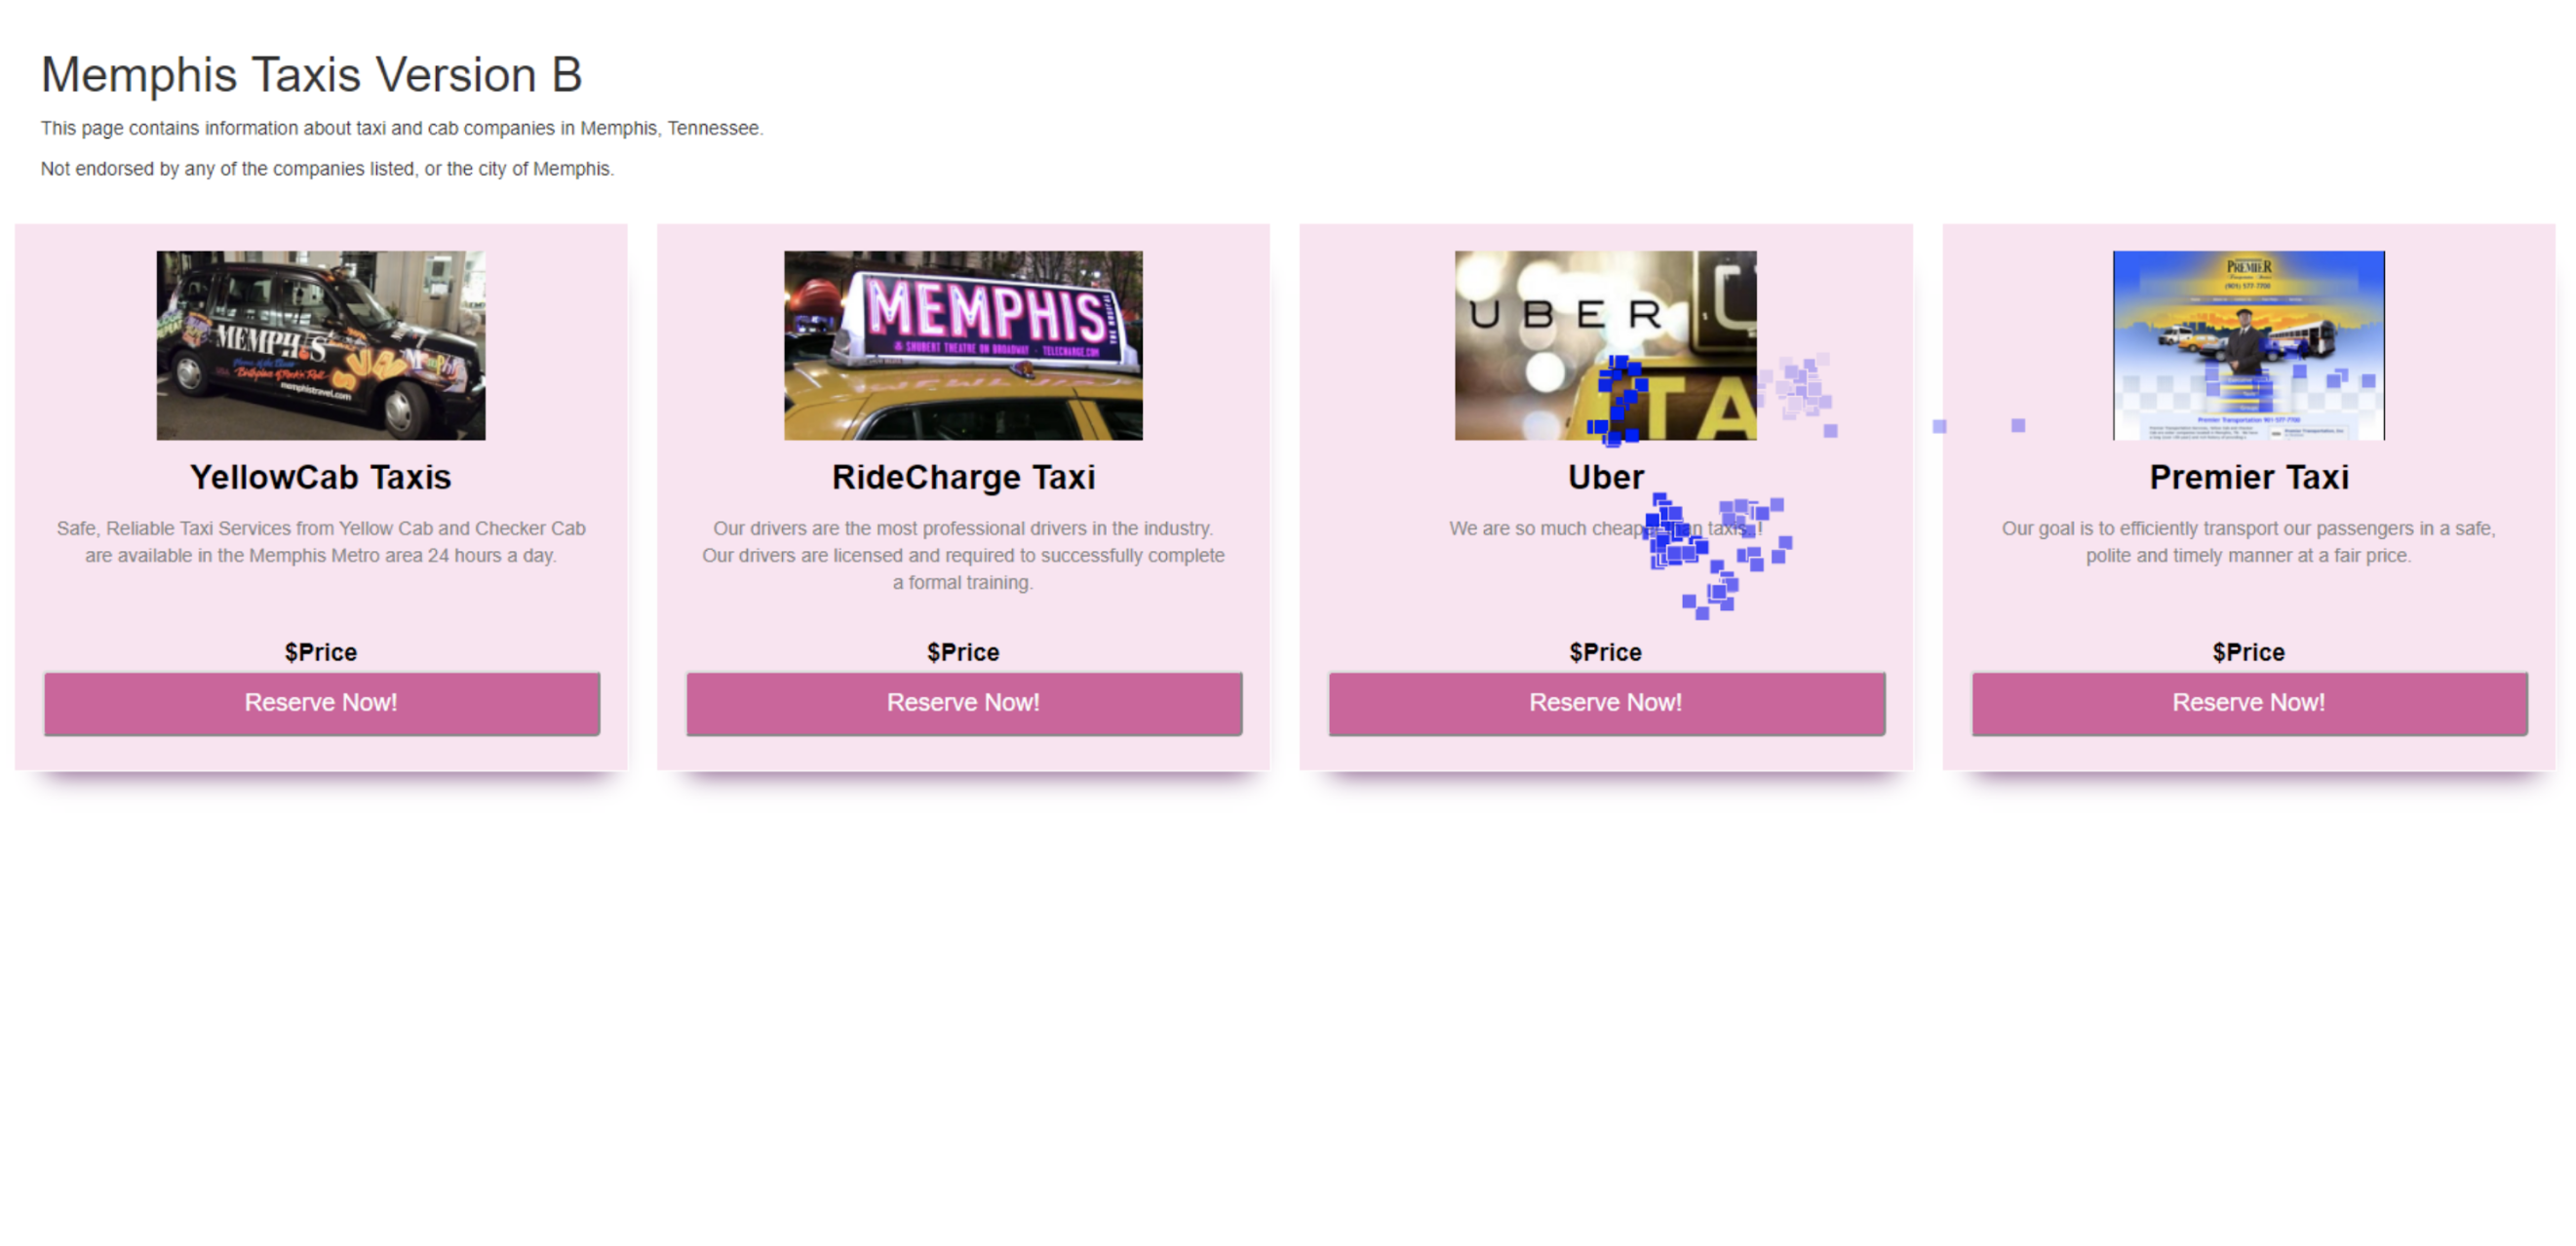
Taxi Booking Site
For this project, we created two new and improved versions of a taxi
booking site, as shown in Image 1. For Version A, we created used a
vertical layout. We added grid boxes around each taxi option and added
a drop shadow to emphasize the different sections. Additionally, we
used different font sizes for the name of the taxi and the description
to add distinction between the different pieces of information. For
Version B, we used a horizontal layout that placed all of the taxi
options next to each other contained within the whole screen. We also
added grid boxes around each taxi to make the content more readable.
For both of these versions, we decided to use the same color palette
so that color was not a factor that played into how users would
interact with the site. Instead, we wanted to focus on how our two
different layouts would affect behavioral trends such as click through
rate, time to click, dwell time, and return rate.
The two versions of our site can be viewed
here
(either Version A or Version B will be displayed each time page is
refreshed/opened)

Part 1: A/B Testing
First, we made a series of hypotheses on how the two versions of our
sites would perform based on four metrics (click through rate, time to
click, dwell time, and return rate). Then, we tested our hypotheses by
having users navigate through one of our two sites and analyzed the
data to conclude whether our results are statistically significant,
using either Chi-Squared test of T-test.
Hypotheses
Click through rate
-
Null: The click-through rate of Version A will be equal to that of
Version B.
-
Alternative: The click-through rate of Version A will be greater
than that of Version B because the layout of Version A is cleaner
and entices the user to select a service offered.
Time to Click
-
Null: The time to click will be the same in Version A and Version B.
-
Alternative: The time to click a button on Version A will be shorter
than that of Version B because the button on Version A is larger,
and there is less content on the initial screen for Version A
compared to Version B.
Dwell time
-
Null: The dwell time will be the same in Version A and Version B.
-
Alternative: The dwell for Version A will be shorter than that of
Version B because users of Version B see all taxi companies on the
page at once and are more likely to choose to click on a company
that they will likely stick with.
Return Rate
-
Null: The return rate of Version A will be equal to that of Version
B.
-
Alternative: The return rate for Version A will be higher than the
return rate for Version B because users of Version B see more
content on the screen and are more likely to read the information
for all of the taxi companies before clicking on the reserve button.
On the other hand, users of Version A see less content on the screen
and are more likely to click on the reserve button before fully
reading information for the other taxi companies, thus causing them
to return back to the web page.
Data Analysis
Click through rate
We began by creating a pivot table in Excel with count of page load
time (how many times page was loaded) and max of click time (0 if they
didn’t click on any links), tallied those with max click time of 0,
and subtracted them from the total number of entries to find the
percentage of people who clicked.
We chose to use the Chi-squared test for click through rate because
this is categorical data (yes or no for each user), as opposed to
having to take the average of some data.
Observed
| Click | No click | Total | |
| Interface A | 29 | 5 | 34 |
| Interface B | 28 | 10 | 38 |
| Total | 57 | 15 | 72 |
Expected
| Click | No click | Total | |
| Interface A | 26.9 | 7.1 | 34 |
| Interface B | 30.1 | 7.9 | 38 |
Final Calculation
| Interface A | 85.3% |
| Interface B | 73.7 |
The calculated chi-squared value was 1.4897 with a degree of freedom
of 1 and p-value of 3.84.
We did not reject the null hypothesis, which was that the
click-through rate will be the same for Version A and Version B,
because our calculated value (1.4898) was less than the reference
value obtained from a p-value of 0.05 and df = 1. The results of
Chi-squared show that the difference between the click-through rates
between Version A and Version B was not statistically significant.
Time to Click
We calculated the average time to click by deleting people with no
clicks, subtracting the page load time of a click entry with the click
time, then averaging users’ results for Version A and B.
Final Calculation
| Interface A | 8846.86 |
| Interface B | 9119.82 |
We chose to use a t-test to see if our data was statistically
significant because we are comparing the average time to click for
interface A with the average time to click for interface B.
We did not reject the null hypothesis, which was that the average time
of the click rate will be the same for Version A and Version B,
because our calculated p-value (0.1490) was less than the reference
value obtained from a p-value of 0.05 and df = 55 (1.673). The results
of the t-statistic test show that the difference between the average
time to click rate between Version A and Version B was not
statistically significant.
We are not confident in the calculated 95% interval (-271.9594 ±
3052.7042) since it contains 0. The results of the t-statistic test
show that the difference between the average time to click rate
between Version A and Version B was not statistically significant.
Dwell Time
We first deleted all the users who did not click on the website and
return to the page. For each of the users who clicked on a link and
returned to the page, we subtracted the first click time from the next
page load time to calculate the dwell time of their first navigation
away from our website.
Final Calculation
| Interface A | 24.3863 seconds |
| Interface B | 76.3807 seconds |
We chose to use a t-test to see if our data was statistically
significant because we are comparing the average dwell time for
interface A with the average dwell time for interface B.
We calculated the t-statistic and gott=0.7360. Looking up the value
for df=36 with p = 0.05 in a t-statistic table, we see that we would
need a t-value of 1.688 for our data to be statistically significant.
Since the absolute value of our t value is lower than 1.688, that
means that our data is not statistically significant, meaning that
there is not a significant difference between the dwell time for
interface A and B. Therefore we did not reject the null hypothesis
that the dwell time would be the same in Version A and Version B
because our results were not statistically significant.
Return Rate
We found the total number of people who clicked on a button for each
version and subtracted the maximum click time from the maximum page
load time, with positive results indicating that the user returned,
and for negative results we manually checked if they returned. Then we
divided the percentage of people who returned by the total number of
people who clicked on a button.
We chose to use the Chi-squared test to decide whether the difference
between version A and B are statistically significant because we are
checking for the percentage of users who return after clicking on a
button; it is categorical data.
Observed
| Total Users Who Clicked and Returned | Total Users Who Clicked and Did Not Return | Total Users Who Clicked | |
| Interface A | 18 | 11 | 29 |
| Interface B | 20 | 8 | 28 |
| Total | 38 | 19 | 57 |
Expected
| Clicked and Return | Click and No Return | |
| Interface A | 23.3 | 10.4 |
| Interface B | 18.1 | 8.6 |
Final Calculation
| Interface A | 63.3% |
| Interface B | 72.4 |
The degree of freedom is 1 and the p-value is 3.84. The percentage
points of the Chi-Squared distribution shows that since 0.5616 is not
greater than 3.84, meaning that the difference between versions A and
B is not statistically significant. Thus, we do not reject the null
hypothesis.
Part 2: Eyetracking
For eye tracking portion of this project, we were able to use an eye
tracker on two participants, one for each version of the site. Then,
we used Javascript and Python to create a heat-map and an animated
replay of the users’ eye movements based off of data collected from
each eye tracking sessions (shown on the next page).
Hypotheses
We instructed the user to book the cheapest taxi. Our hypothesis is
that users of Version A will focus on the descriptions and spend more
time searching for the taxi that they want to click due to having to
scroll through options. Meanwhile, users of Version B are able to view
all of the information at once since it is all contained on one
screen, so they will not look at the information as closely and click
on a button in a shorter amount of time. Since our instruction of the
eye-tracking experiment is different from that of the A/B testing data
collection (to simply choose a taxi), our hypotheses differ a little
from Part 1.
Version A: Eye Tracking
Version B: Eye Tracking
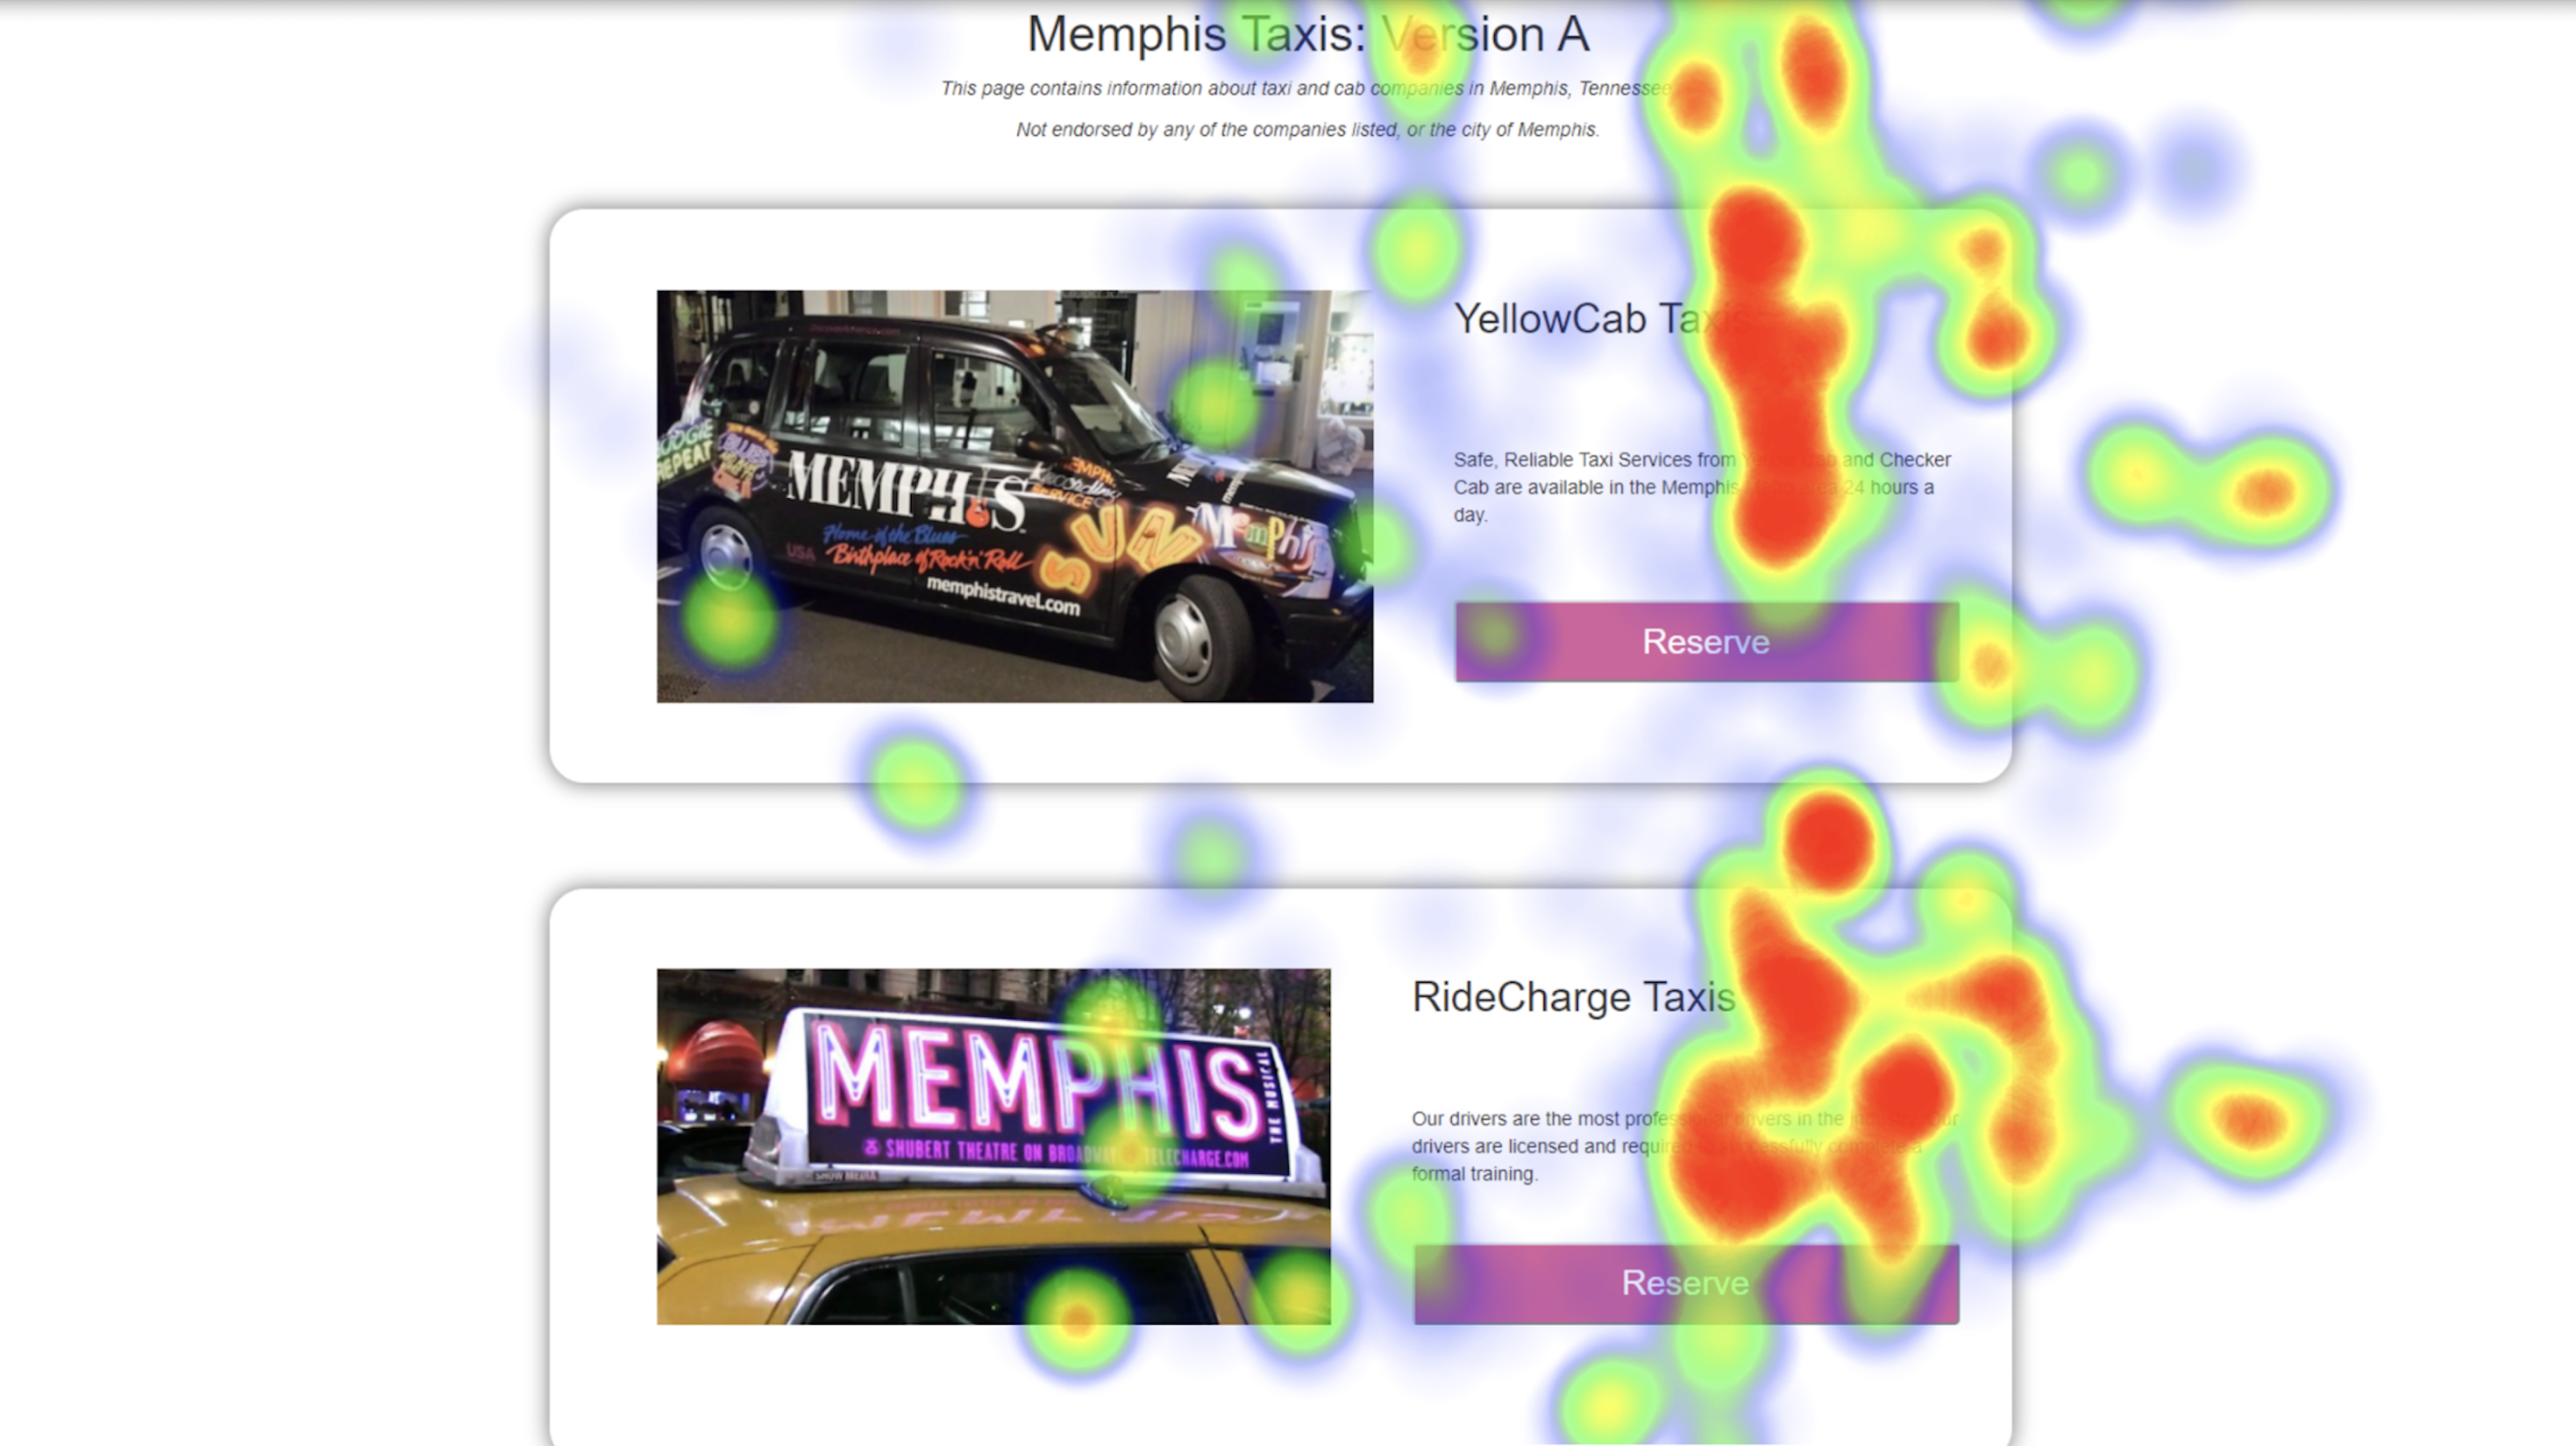
Version A: Heat Map
Version B: Heat Map
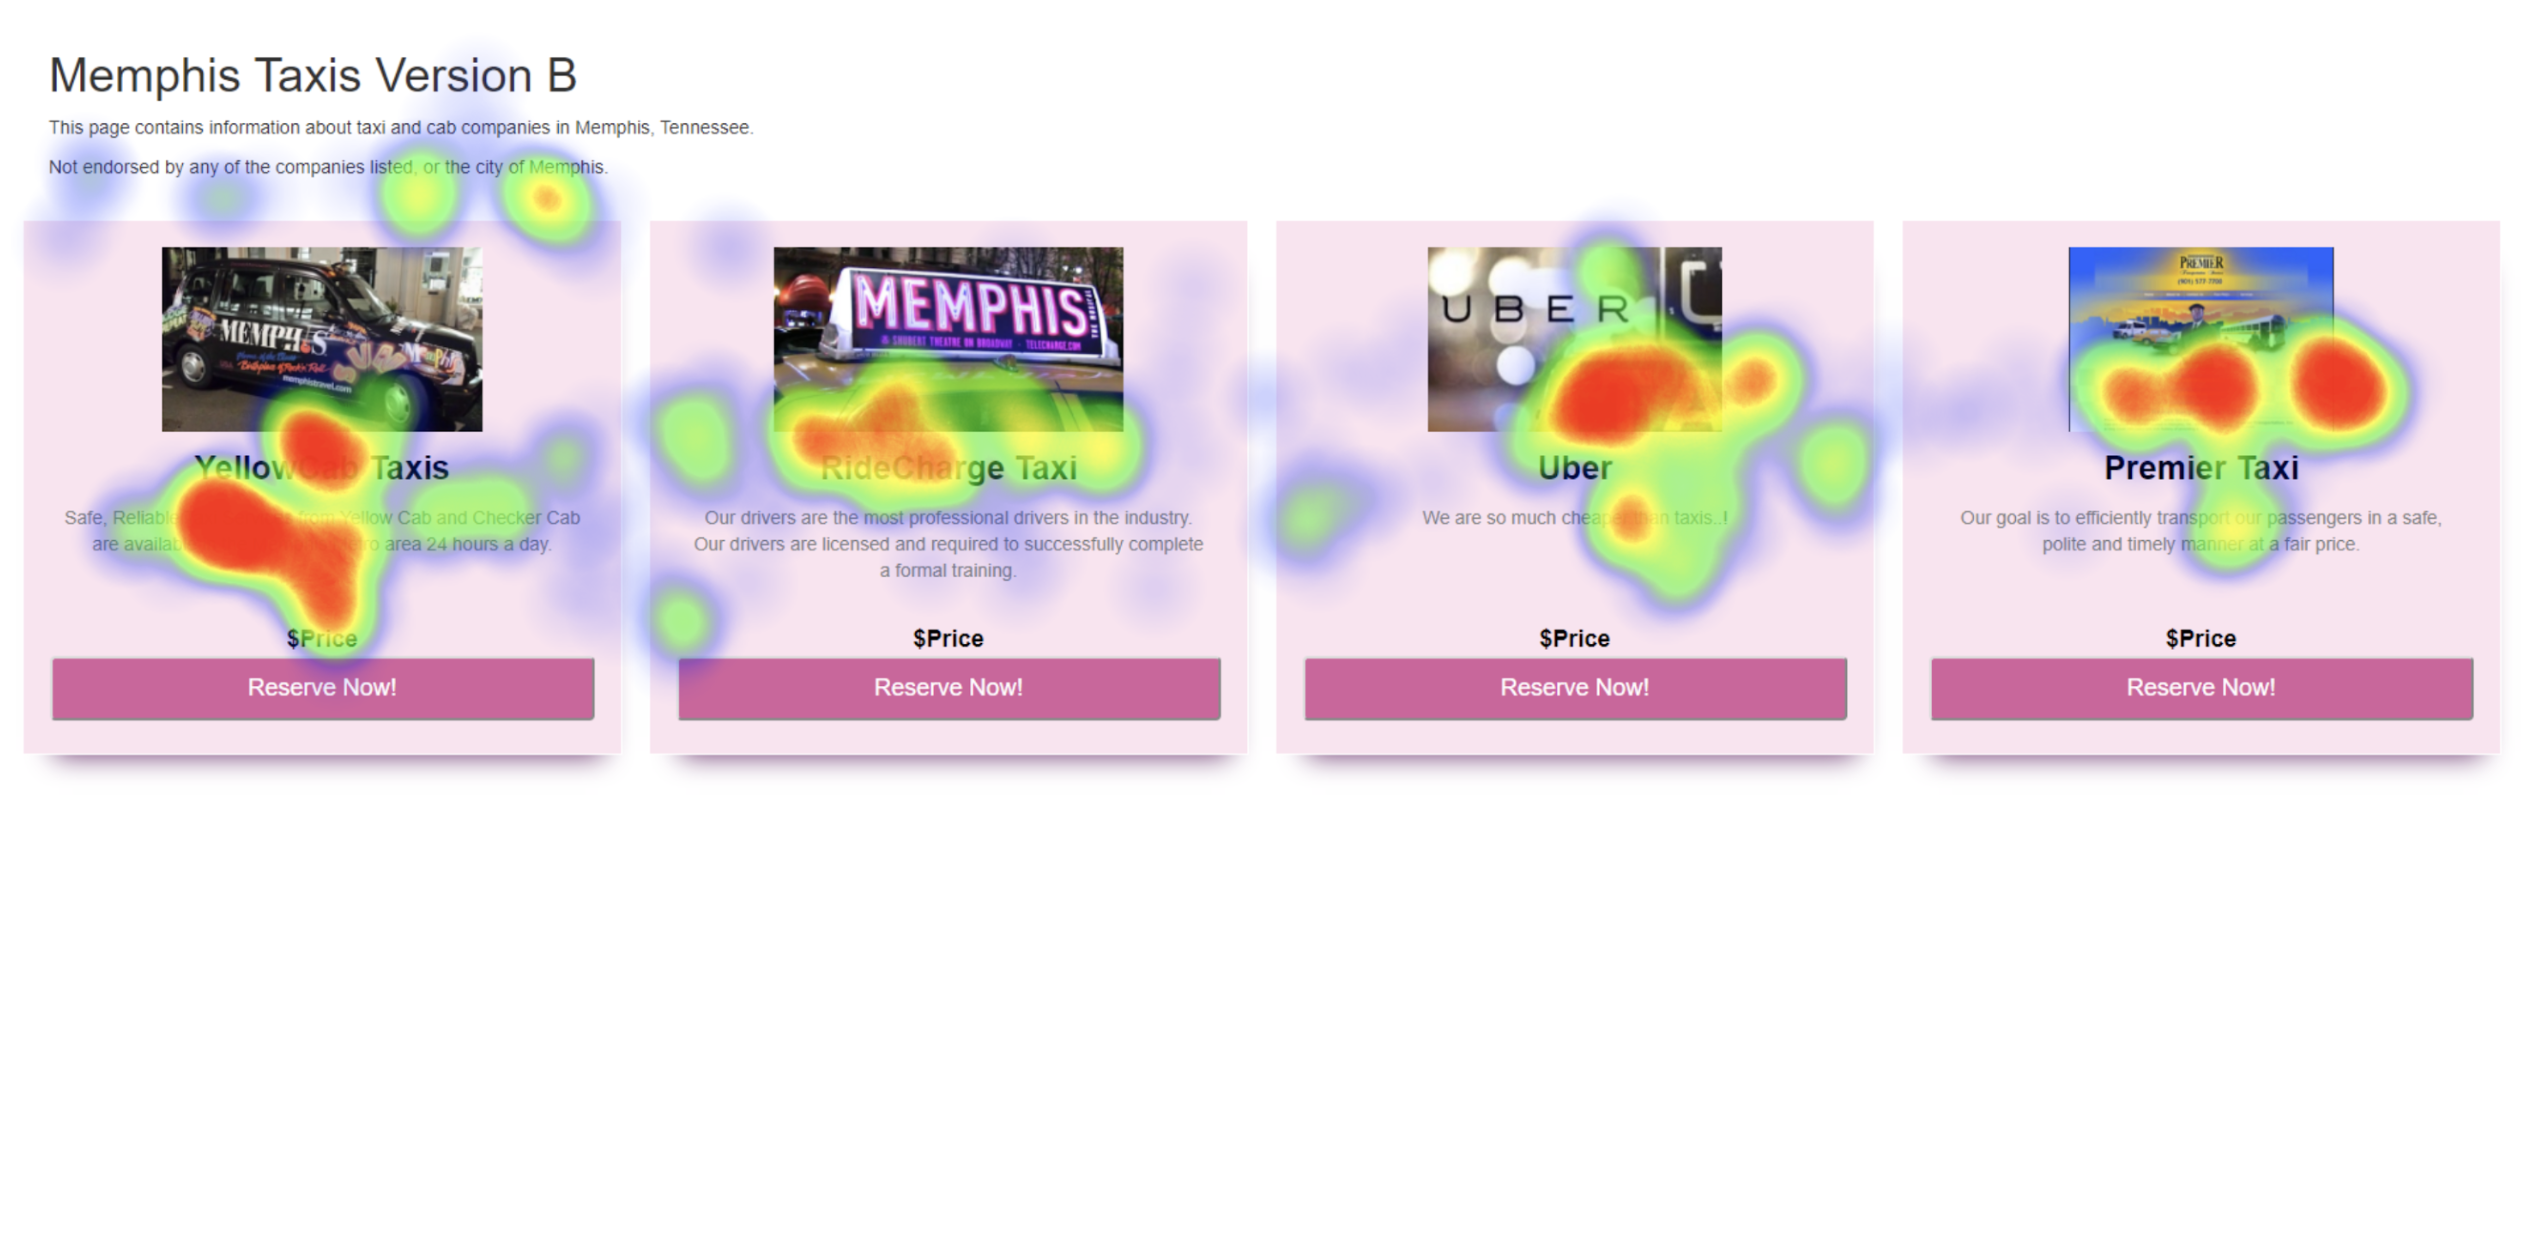
Interpretation of Visualizations
The eye tracking data shows that the user for Version A focused on the
description section for each section as they scrolled through the site
while the user for Version B does not focus on the description as much
and looks at the images before they click on a button. Additionally,
the number of data points show that the user for Version A spent a
longer time on the site than the user for Version B. Thus, our
findings support our hypothesis.
Part 3: Comparison
Based on the data analysis and eye-tracking results, we propose that
Memphis Taxis Co. uses Interface A due to its higher click-through
rate and lower click time. The percentage of click-through rate of
Interface A (85.3%) is higher than that of Interface B (73.7%), which
might be caused by the cleaner design in simplifying information
retrieval and the decision-making process. Moreover, the average time
to click for Interface A (8847.86 ms) is lower than that of Interface
B (9119.82 ms), which suggests that Interface A’s vertical layout
helps people consider options individually and make quicker decisions,
unlike Interface B where users reads and compares each option before
deciding. The eye-tracking heatmap shows that Interface A’s user
focused on several descriptions before making her final decision and
had a longer click time than Interface B’s eye-tracking user, contrary
to the results of our A/B Test, which is due to a different command
given to the user. Therefore, despite the results that advocates for
the use of Interface A, we should conduct more tests to achieve
statistically significant results and use the same commands for A/B
data collection and eye-tracking.
When comparing data for eye-tracking and A/B testing, we noticed that
in eye tracking, there is no measurement for behavioral trends such as
return rate and dwell time because once the user clicks on a button,
the eyetracking session ends. The advantage with using A/B testing
over eye tracking is that with A/B testing is that you are able to get
more data related to time and when users leave the site, such as
return rate and dwell time. On the other hand, the advantage of using
eye tracking over A/B testing is that you can find where on the screen
users are looking which helps inform the areas on the screen that grab
the users’ attention most, thus informing particular design choices on
the screen that should be made. The visual representation of the heat
map can be used to make direct comparisons between versions to show
whether certain changes have an effect on eye movement.
One metric that could be used unethically would be click through rate
if images or text are intentionally misleading in order to get users
to click on it. Another metric that could be used unethically would be
conversion rate which is the number of conversions (people who
completed a desired goal) divided by the total number of visitors.
This can be used to make users make unwanted purchases without taking
into consideration what is most desirable for the user.
Conclusion
This project effectively combines design with data collection. We used
the eye tracker to create a heatmap which offered different data
visualization from that of the A/B Testing results. Both provided
insightful results to how users interact with the two different sites.
To further build onto this project, we would keep our hypotheses for
A/B Testing and eye-tracking more consistent and conduct tests on a
larger group of users that are not in our class.
Other Projects